Plot genome segmentation
plotSegment(
  seg,
  exclude = NULL,
  type = c("ranges", "barplot", "boxplot"),
  region = NULL
)
Arguments
- seg
the segmentation GRanges returned by
segmentDensityfunction- exclude
GRanges of excluded region
- type
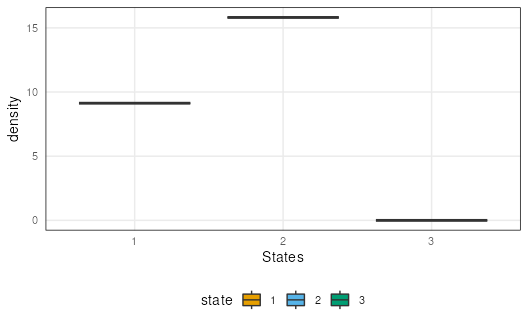
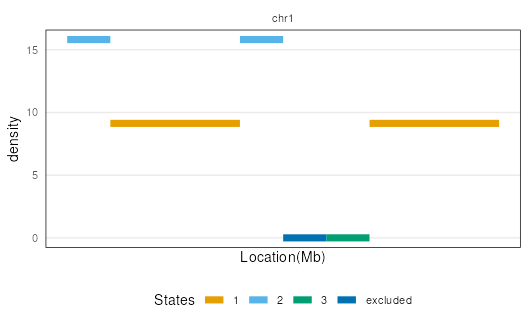
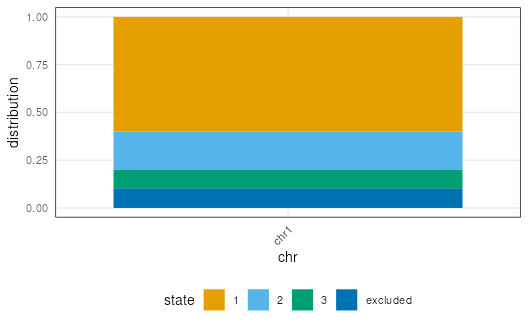
the type of plot returned. Choices are segmentation plot included ranges information, barplot showing segmentation states' distribution across chromosome, or a box plot indicating average density within each states. Default is all plots are displayed. The y axis
"density"represent square root of overlap counts within segment length. If a user defined segmentation GRanges is given, the y axis is default to be 1 for all states in segmentation plot.- region
GRanges of stricted region that want to be plotted.
Value
A ggplot set by type argument
Examples
example("segmentDensity")
#>
#> sgmntD> n <- 10000
#>
#> sgmntD> library(GenomicRanges)
#>
#> sgmntD> gr <- GRanges("chr1", IRanges(round(
#> sgmntD+   c(runif(n/4,1,991), runif(n/4,1001,3991),
#> sgmntD+     runif(n/4,4001,4991), runif(n/4,7001,9991))),
#> sgmntD+   width=10), seqlengths=c(chr1=10000))
#>
#> sgmntD> gr <- sort(gr)
#>
#> sgmntD> exclude <- GRanges("chr1", IRanges(5001,6000), seqlengths=c(chr1=10000))
#>
#> sgmntD> seg <- segmentDensity(gr, n=3, L_s=100, exclude=exclude, type="cbs")
#> Analyzing: Sample.1
plotSegment(seg, exclude, type = "ranges")
#> Warning: `aes_string()` was deprecated in ggplot2 3.0.0.
#> ℹ Please use tidy evaluation idioms with `aes()`.
#> ℹ See also `vignette("ggplot2-in-packages")` for more information.
#> ℹ The deprecated feature was likely used in the nullranges package.
#>   Please report the issue at
#>   <https://support.bioconductor.org/tag/nullranges/>.

plotSegment(seg, exclude, type = "barplot")

plotSegment(seg, exclude, type = "boxplot")